Statistical toolset for machine learning [nn part 4]
This article needs more work.
I didn’t plan to write this part, however, I found out that there is a lot of obscure vocabulary and some misnomers used in the context of deep learning and that very few people seem to fully understand what is going on.
Machine learning is still pretty recent and is at an empirical state where we know how to use it, but we don’t really understand how it works.
Machine learning and applied statistics have a lot in common. However, Machine Learning heavily focus on algorithm, implementation and results, while statistics focus on data, model, analysis and interpretation.
To be able to have a better understanding of ML and DL, we need to have a solid understanding of Statistics. The goal of this article is to give a quick overview of some of the tools used in ML.
Let’s begin with a few definitions
Population and sample
A population is the total set of observations that can be made. If we are studying the age of people, the population is the set of ages of all the people in the world. However, we usually don’t have access to the whole population. We only have a small part : a sample.
Statistic
A statistic is a characteristic of a sample. Generally a statistic is used to estimate the value of a population parameter. Any measurable characteristic of the sample is a statistic. (def from stattrek)
When a statistic is used to estimate a population parameter we call it an “estimator”.
For example the average age of a sample, is an estimator of the population mean.
Estimators
We want to extract information from populations. Populations can be (partially) described by some parameters. Because populations are often very large, we can not study the whole population, therefore, we are not able to know the exact values of the parameters.
But we can still estimate their values using estimators.
An estimator is a function of the sample, it’s a rule that tells how to calculate an estimate of a parameter from a sample. An estimate is a value of an estimator calculated from a sample.
Different estimators are possible for the same parameter, we need to find a good one, the best one.
Estimators properties
Quality of an estimator
Let’s say we want to estimate the value of a population parameter:
\[\beta\]We come up with an estimator:
\[\hat{\beta}\]To try our estimator we take N samples from the population:
\[\mathbb{S}=\left \{ S_1, ...,S_N \right \}\]With each sample, we calculate an estimate of the population parameter:
\[\hat{\beta} : S_i \mapsto \beta^*_i\]We can plot the frequency distribution of our estimator, we could obtain a bell curve (normal distribution):
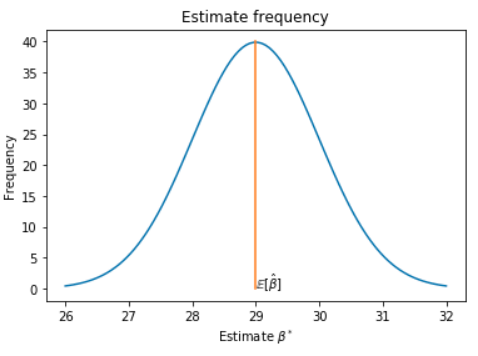
If the estimator is good its expectation should be very close to the truth. To evaluate the goodness of an estimator we introduce the “Bias criteria”.
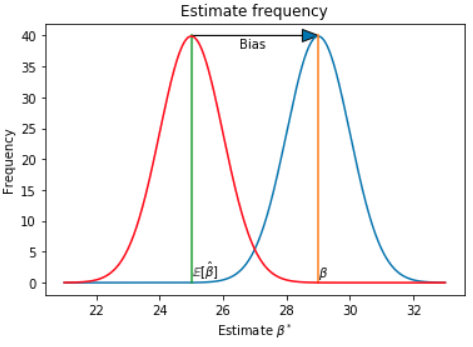
\[Bias(\hat{\beta})=\mathbb{E}\left [ \hat{\beta} \right ] - \beta\]If :
\[\mathbb{E}\left [ \hat{\beta} \right ] = \beta\]then the estimator is unbiased.
But how do we know the true beta if it’s unknown ? Sssshh don’t think too much, don’t ask questions
If it’s biased, it’s not good :
Consistency (variance)
An other criteria of “goodness” is consistency. An estimator is consistent if its expectation converges to the true value when the number of samples increases. The sampling distribution of the estimator becomes increasingly concentrated at the true parameter value.
\[\lim_{N\rightarrow + \infty }\mathbb{E}\left [ \hat{\beta} \right ] = \beta\]
(Image from wikipedia)
One could try to talk about variance here, but one has too much to do and not enough time.
Consistency is a nice property of an estimator. A biased but consistent estimator can still be used to estimate a good value if the number of samples increase. For example let’s say we want to estimate the mean mu of a population. Each individual of the population can be written as :
\[x_i = \mu + \epsilon_i\](\epsilon_i) is some sort of idiosyncratic error which we can’t predict and has a mean of 0.
Let’s say we want to estimate \mu with :
\[\tilde{x} = \frac{1}{N-1}\sum_{i=1}^{N}x_i\]We can show that it is biased :
\[\begin{align*} \mathbb{E}\left [ \tilde{x} \right ] &= \frac{1}{N-1}\sum_{i=1}^{N}\mathbb{E}\left [ x_i \right ]\\ &=\frac{1}{N-1}\sum_{i=1}^{N}\mathbb{E}\left [ \mu + \epsilon_i \right ] \\ &= \frac{N \cdot \mu}{N-1} \neq \mu \end{align*}\]However, if N is large enough, the bias almost disappear :
\[\lim_{N\rightarrow \infty}\frac{N \cdot \mu}{N-1} = \mu\]So when you have a high variance in a ML problem, having more training examples can be a good solution. The variance should become smaller and the expectation should shift to a better value.
Maximum likelihood estimation
The goal of maximum likelihood is to find the optimal way to fit a distribution to the data. There are lots of different types of distributions for different types of data.
Let’s say we have a population of dogs and cats. We take a sample of the population of N independent examples and we want to estimate the probability p that an individual is a cat. Because we only have dogs and cats, we can define a probability mass function which determines the probability that an individual is a dog or a cat :
\[f(x_i| p) = p^{x_i}\cdot(1-p)^{1-x_i} \\ \text{where }x_i = \left\{\begin{matrix} 1, \text{if cat}\\ 0, \text{if dog} \end{matrix}\right.\]Note that this is a Bernoulli distribution. For one example:
\[f(1| p) = p^{1}\cdot(1-p)^{0} = p \\ f(0| p) = p^{0}\cdot(1-p)^{1} = 1-p\]For N examples:
\[f(x_1,x_2,...,x_N| p)=f(x_1| p)f(x_2| p)...f(x_N| p) \\ \begin{align*} f(x_1,x_2,...,x_N| p) &= \prod_{i=1}^{N}f(x_i| p) \\ &= \prod_{i=1}^{N}p^{x_i}\cdot(1-p)^{1-x_i} \end{align*}\]Inside the population there is a true but unknown probability p. We are trying to come up with an estimator (\hat{p}) to find the best possible value of p that fits the data the best.
The likelihood represents the probability that we would have got that sample of individuals if we actually knew the probability p in the population. But we don’t know p and we try to estimate it.
\[Likelihood =\prod_{i=1}^{N}\hat{p}^{x_i}\cdot(1-\hat{p})^{1-x_i}\]we want to maximize the likelihood (need more explanation here)
\[\frac{\partial L}{\partial \hat{p}}=0 \Rightarrow \hat{p}_{ML}\](ML stands for Maximum Likelihood)
To be able to compute the derivative, we transform this product into a sum, with the log function :
\[\begin{align*} l &= log(\prod_{i=1}^{N}\hat{p}^{x_i}\cdot(1-\hat{p})^{1-x_i})\\ &=\sum_{i=1}^{N}log[\hat{p}^{x_i}\cdot(1-\hat{p})^{1-x_i}] \\ &=\sum_{i=1}^{N} [ log(\hat{p}^{x_i})+log((1-\hat{p})^{1-x_i}) ]\\ &=\sum_{i=1}^{N} [ x_i \cdot log(\hat{p})+(1-x_i) \cdot log(1-\hat{p}) ]\\ &= log(\hat{p}) \cdot \sum_{i=1}^{N}x_i + log(1-\hat{p}) \sum_{i=1}^{N}(1-x_i) \end{align*}\]We can even simplify this equation if we see that :
\[\text{the mean of x} = \bar{x} = \frac{1}{N}\sum_{i=1}^{N}x_i\] \[l = N \cdot \bar{x} \cdot log(\hat{p}) + N \cdot (1-\bar{x}) \cdot log(1-\hat{p})\]Computing
\[\frac{\partial l}{\partial \hat{p}}=0 \Rightarrow \hat{p}_{ML}\]is equivalent to computing without the log, because the logarithm is monotone (so the variations of L do not change).
Now it’s really simple to solve this equation (for the sake of clarity, I don’t use the subscript ML) :
\[\frac{\partial l}{\partial \hat{p}} = \frac{N \cdot \bar{x}}{\hat{p}}-\frac{N \cdot (1-\bar{x})}{1-\hat{p}}=0 \\ \frac{N \cdot \bar{x}}{\hat{p}}=\frac{N \cdot (1-\bar{x})}{1-\hat{p}} \\ \frac{\bar{x}}{\hat{p}}=\frac{(1-\bar{x})}{1-\hat{p}} \\ \bar{x} \cdot (1-\hat{p}) = \hat{p} \cdot (1-\bar{x}) \\ \bar{x}-\bar{x}\hat{p} = \hat{p} -\bar{x}\hat{p} \\ \bar{x}= \hat{p}\]The maximum likelihood is equivalent to counting the number of cat in the sample and dividing it by the total number of individual in the sample.
\[\hat{p}_{ML}=\frac{1}{N}\sum_{i=1}^{N}x_i\]All of this just for that, yeet that was obvious.
link to Machine learning
The main idea to remember and that we use in ML is that there is some sort of true but unknown set of parameters or functions of a population that we want to estimate by studying a sample of that population.
In supervised learning and deep learning, our hypothesis is that there is a parametric function f linking the input x to the output y. We estimate that function using deep neural networks.